Profiling the Sage ERP X3 script code is important to obtain the best possible performance. It localizes time consuming programs and measures how often certain code sections are called. This is possible by using a dedicated library.This is a two step process to get the profiling of X3 code (i.e Start and stop of profiling process)
New Stuff: Set default bank globally in Sage ERP X3
1. Starting the profile process
This is performed by using the function ASYRTIMING.START
STAT=func ASYRTIMING.START("",1)This function includes two parameters:
a. A string character value that defines the temporary file name without an extension and path, where the calls and timestamps are written. If an empty value is given, the name will be generated .
b. An additional integer is set to ‘0’ by default. Its value will be modified to ‘1’ if the code called by Gosub needs to be analyzed.
2. Ending the profile process
This is performed by using the function ASYRTIMING.STOP
STAT=func ASYRTIMING.STOP(GACTX,"",1,WFICTRACE)This function includes four parameters:
a. A pointer on the current context.
b. The temporary file name where the calls and timestamps have been written. If the file name is not provided, the same algorithm will be used to generate it .
c. The same integer value to know if Gosub must be analyzed.
d. A string variable that returns the generated detailed log file.
For Example:
# Start the profile
Local integer STAT
STAT=func ASYRTIMING.START("",1)
# The X3 code
...
# End the profile
Local char WFICTRACE
STAT=func ASYRTIMING.STOP(GACTX,"",1,WFICTRACE)
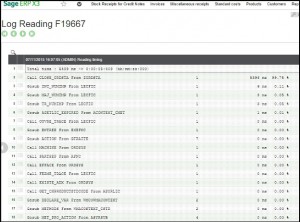
You get the log generated when the function stops which can be read by you in log reading.
Below is the snipplet of the log genrated by the profiling process.
Hope this Helps!
Also Read :
1)How to call specific file of an action through code?
2)How to open the object managed screen via code?
3)How to use the Presentation Style through code?